
Mint Shelf blog
Stop Paying for Status Pages. Vibe-Code Your Own.
Before you pay for a status page, it’s worth considering how much of it you could build with tools you already use.
On this page
Stop Paying for Status Pages. Vibe-Code Your Own.
Before you pay for a status page, it’s worth considering how much of it you could build with tools you already use. That’s what we did for Mint Shelf. With coding agents like Codex available to help with implementation, a custom status system is an option worth looking at, even for a small team.
We used GitHub Pages to host the page and GitHub Issues to record incidents, with automated checks running through GitHub Actions and Depot. Resend handles subscription emails, while PostHog lets us verify analytics delivery. We could put those pieces together ourselves and write checks around how our marketplace actually works, rather than add a dedicated status-page subscription.
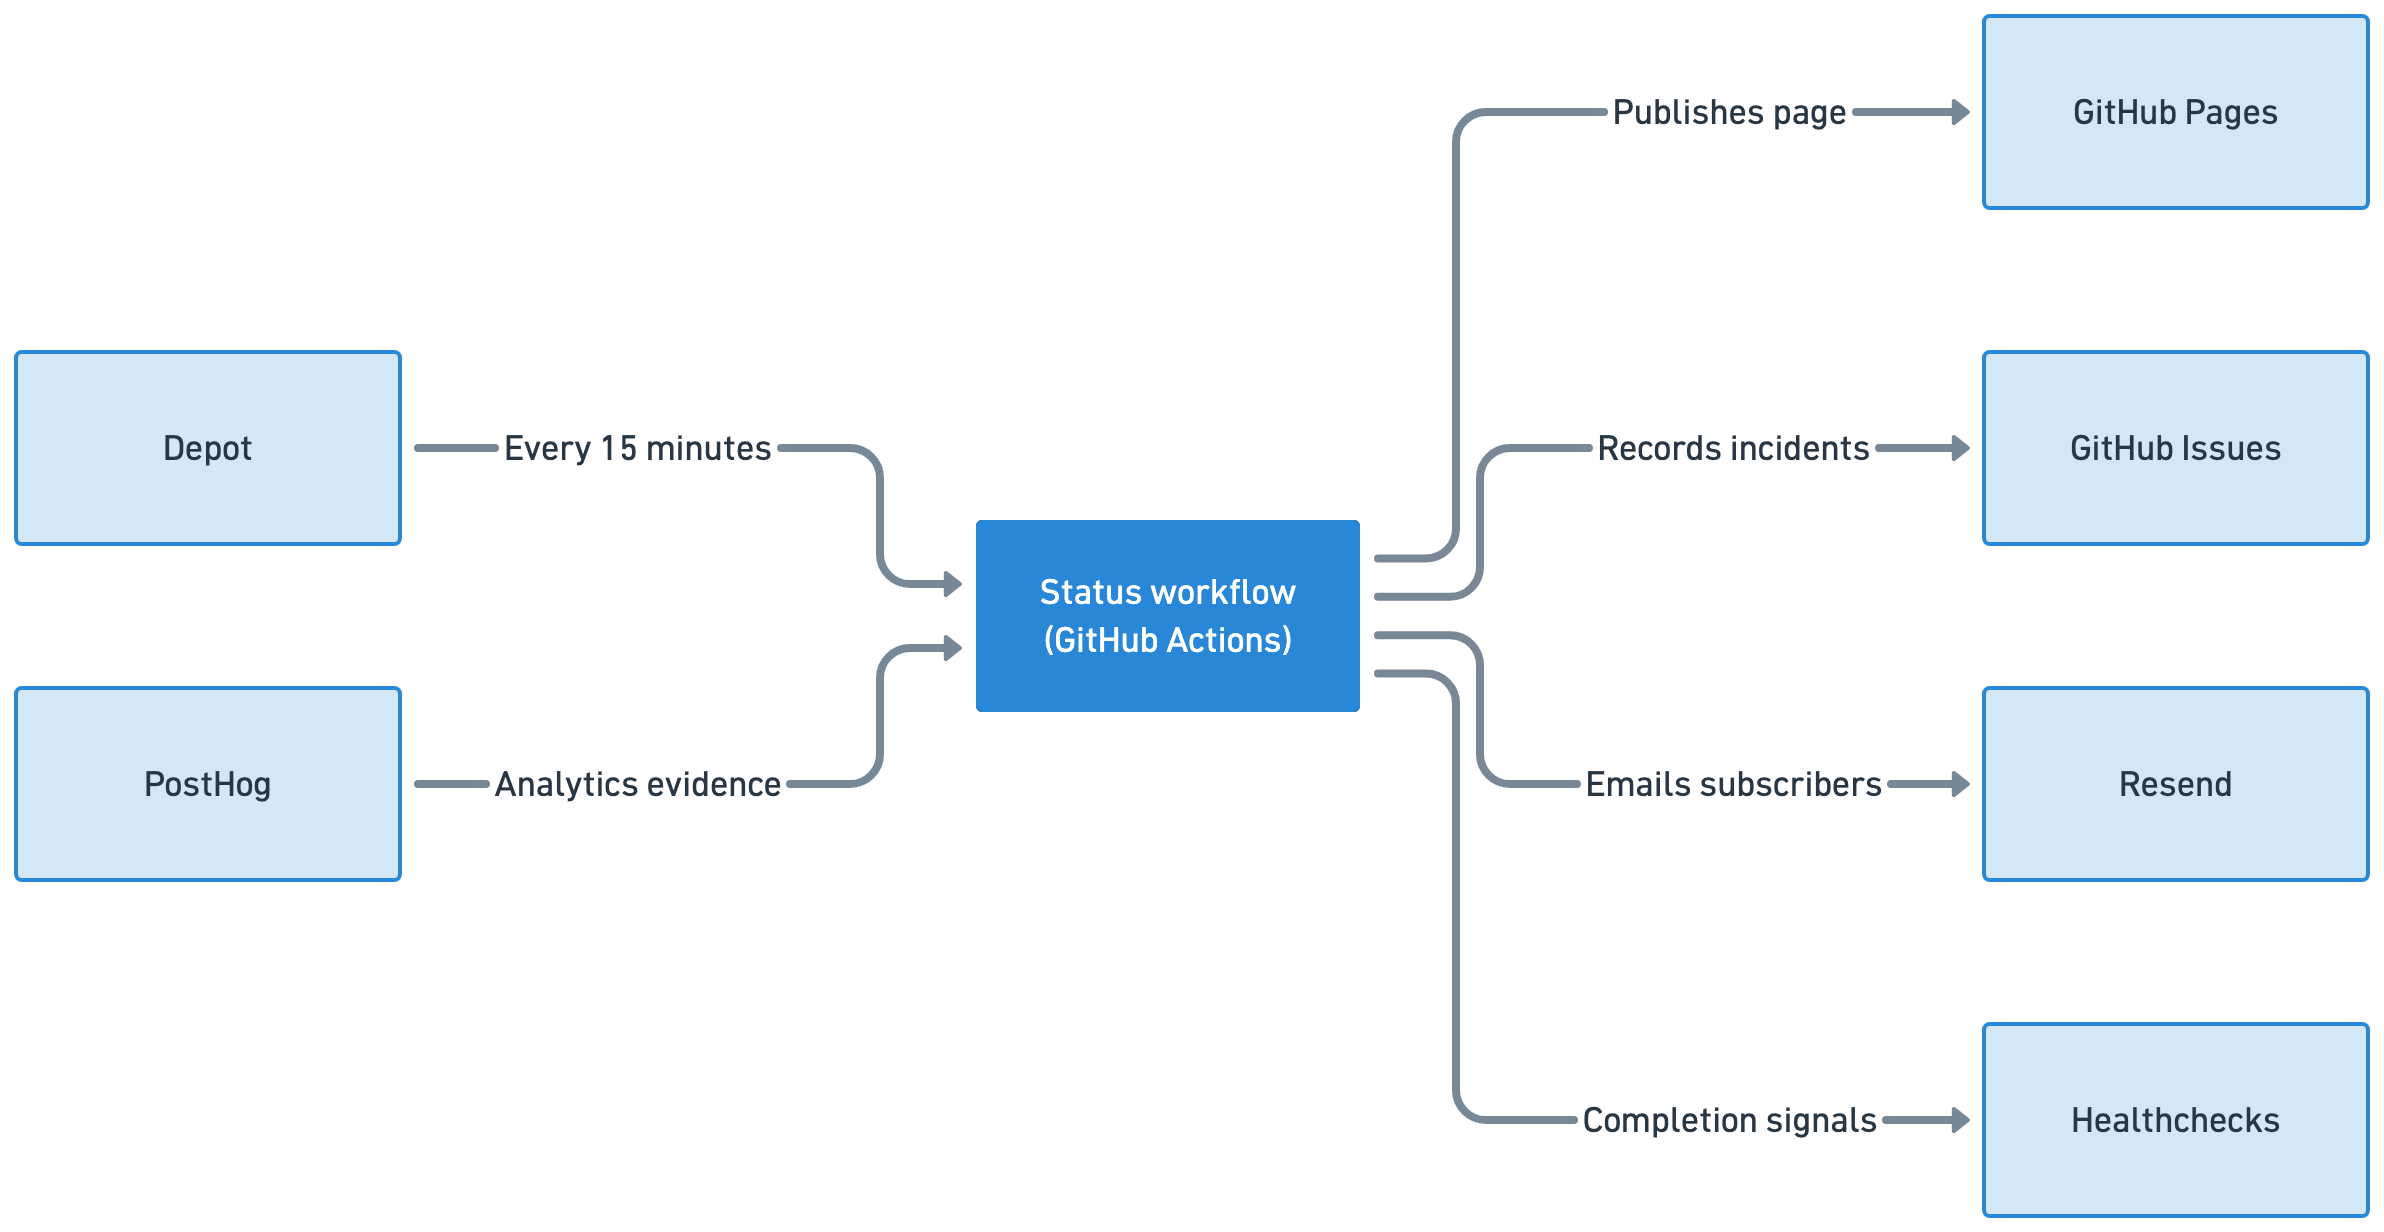
How our existing services fit together in Mint Shelf’s status system.
So what actually goes into a status page?
Most of us recognize a status page: service names, colored indicators, maybe an incident update explaining why something isn’t working. When we looked into what makes a useful one, we needed to look beyond that interface.
An automated status system has a few main parts:
- Checks that observe the product. These might request an API, open a page in a browser or inspect evidence from a background job.
- Rules for interpreting the results. A failed check needs to mean something specific. The system also needs to handle incomplete checks, avoid opening a new incident for every repeated failure and recognize recovery.
- A page and incident history. These communicate the current condition and preserve what happened.
- Notifications. Customers can subscribe to incident updates, while the team can receive separate alerts about internal problems.
The page also needs to remain available when the application isn’t. Mint Shelf uses Cloudflare and PlanetScale, while our status page lives on GitHub Pages, outside the application’s hosting stack.
A third-party service can handle several of these pieces for you. Some focus on communicating incidents; others bundle the page with monitoring and on-call tools:
| Service | What it provides |
|---|---|
| Atlassian Statuspage | Component statuses, incident history and subscriber updates. Its free public-page plan supports 100 subscribers and email notifications; paid plans add custom domains, more subscribers and, on higher tiers, SMS and webhook notifications. |
| Better Stack | Monitoring, heartbeats, incident management and status pages. Its free tier is aimed at personal projects; paid options include on-call phone/SMS alerts and additional page customization. |
| UptimeRobot | Monitoring with status pages. Its free plan is aimed at hobby and nonprofit projects, with five-minute checks and basic status pages; paid plans offer faster checks, custom domains and more pages. |
There’s value in having those features managed for you. For Mint Shelf, though, we wanted a relatively straightforward setup using tools we already worked with, plus checks we could adjust for our own product. We didn’t need to adopt a broader incident-management platform to do that.
Deciding what ours needed
Mint Shelf is a marketplace, and our initial monitoring covered its public pages, search, authentication and Scout interface. It had 45 checks using a combination of HTTP requests and Playwright browser checks.
The HTTP checks inspected responses from pages and APIs, while Playwright opened the application in Chromium to check what a customer would actually see. For login, that meant checking that the form appeared and was usable, because a successful server response wouldn’t help someone staring at a page with no login form.
We wanted to keep that public coverage, fix misleading checks and add an internal view for Demo, Staging and selected backend features. We used Codex to help research monitoring practices and investigate the existing code, then organized the improvements into focused issues.
One alert showed why reviewing the checks mattered. The search API had returned valid empty results, but the browser check was waiting for a listing card. With no listing to find, the monitor reported a search problem. A marketplace search can return nothing without anything being broken, so our check could fail even when search was working.
We changed it to require the search interface and a recognized outcome: results, fallback content or an intentional empty state. That allowed an empty search to pass without allowing a blank page to pass. Some other checks first found a listing or event, then opened its detail page. If a valid response contained no suitable item, that dependent check could be marked not applicable while the remaining checks continued.
We also needed to distinguish an application failure from a monitor that couldn’t finish. If Chromium couldn’t run, we hadn’t established whether customers could use the application. Reporting an outage would be misleading, but so would reporting a fresh all-clear. Incomplete observations now keep the previous customer state and show that monitoring didn’t finish.
Getting the checks to run when we expected
We had configured the workflow to run every 15 minutes. While reviewing its history, we discovered that it wasn’t coming close.
Across 100 scheduled runs examined from September 9 through September 23, every interval was longer than 45 minutes. Sixty-three were longer than three hours, and the longest gap was about six hours and 47 minutes. An outage could start and end during one of those gaps without the monitor ever seeing it.
Turns out, GitHub’s scheduled triggers can be delayed or even dropped under load. That behavior is covered in GitHub’s documentation, but seeing those gaps in our own history made the consequences much more concrete. The jobs generally ran successfully once GitHub created them; the delay was in triggering the workflow, not executing the checks on Depot’s runners.
We moved scheduling to Depot while keeping the existing GitHub workflow, and left the old timer enabled as a fallback during rollout. After verifying all 380 expected Depot slots across the measured period, we removed the redundant GitHub schedule.
Even monitoring needs monitoring, so we added Healthchecks to watch for regular signals from the workflow. One reports that monitoring completed, and another reports that the page published successfully. If those signals stop arriving, Healthchecks can alert us even if the workflow never starts or gets far enough to report its own failure.
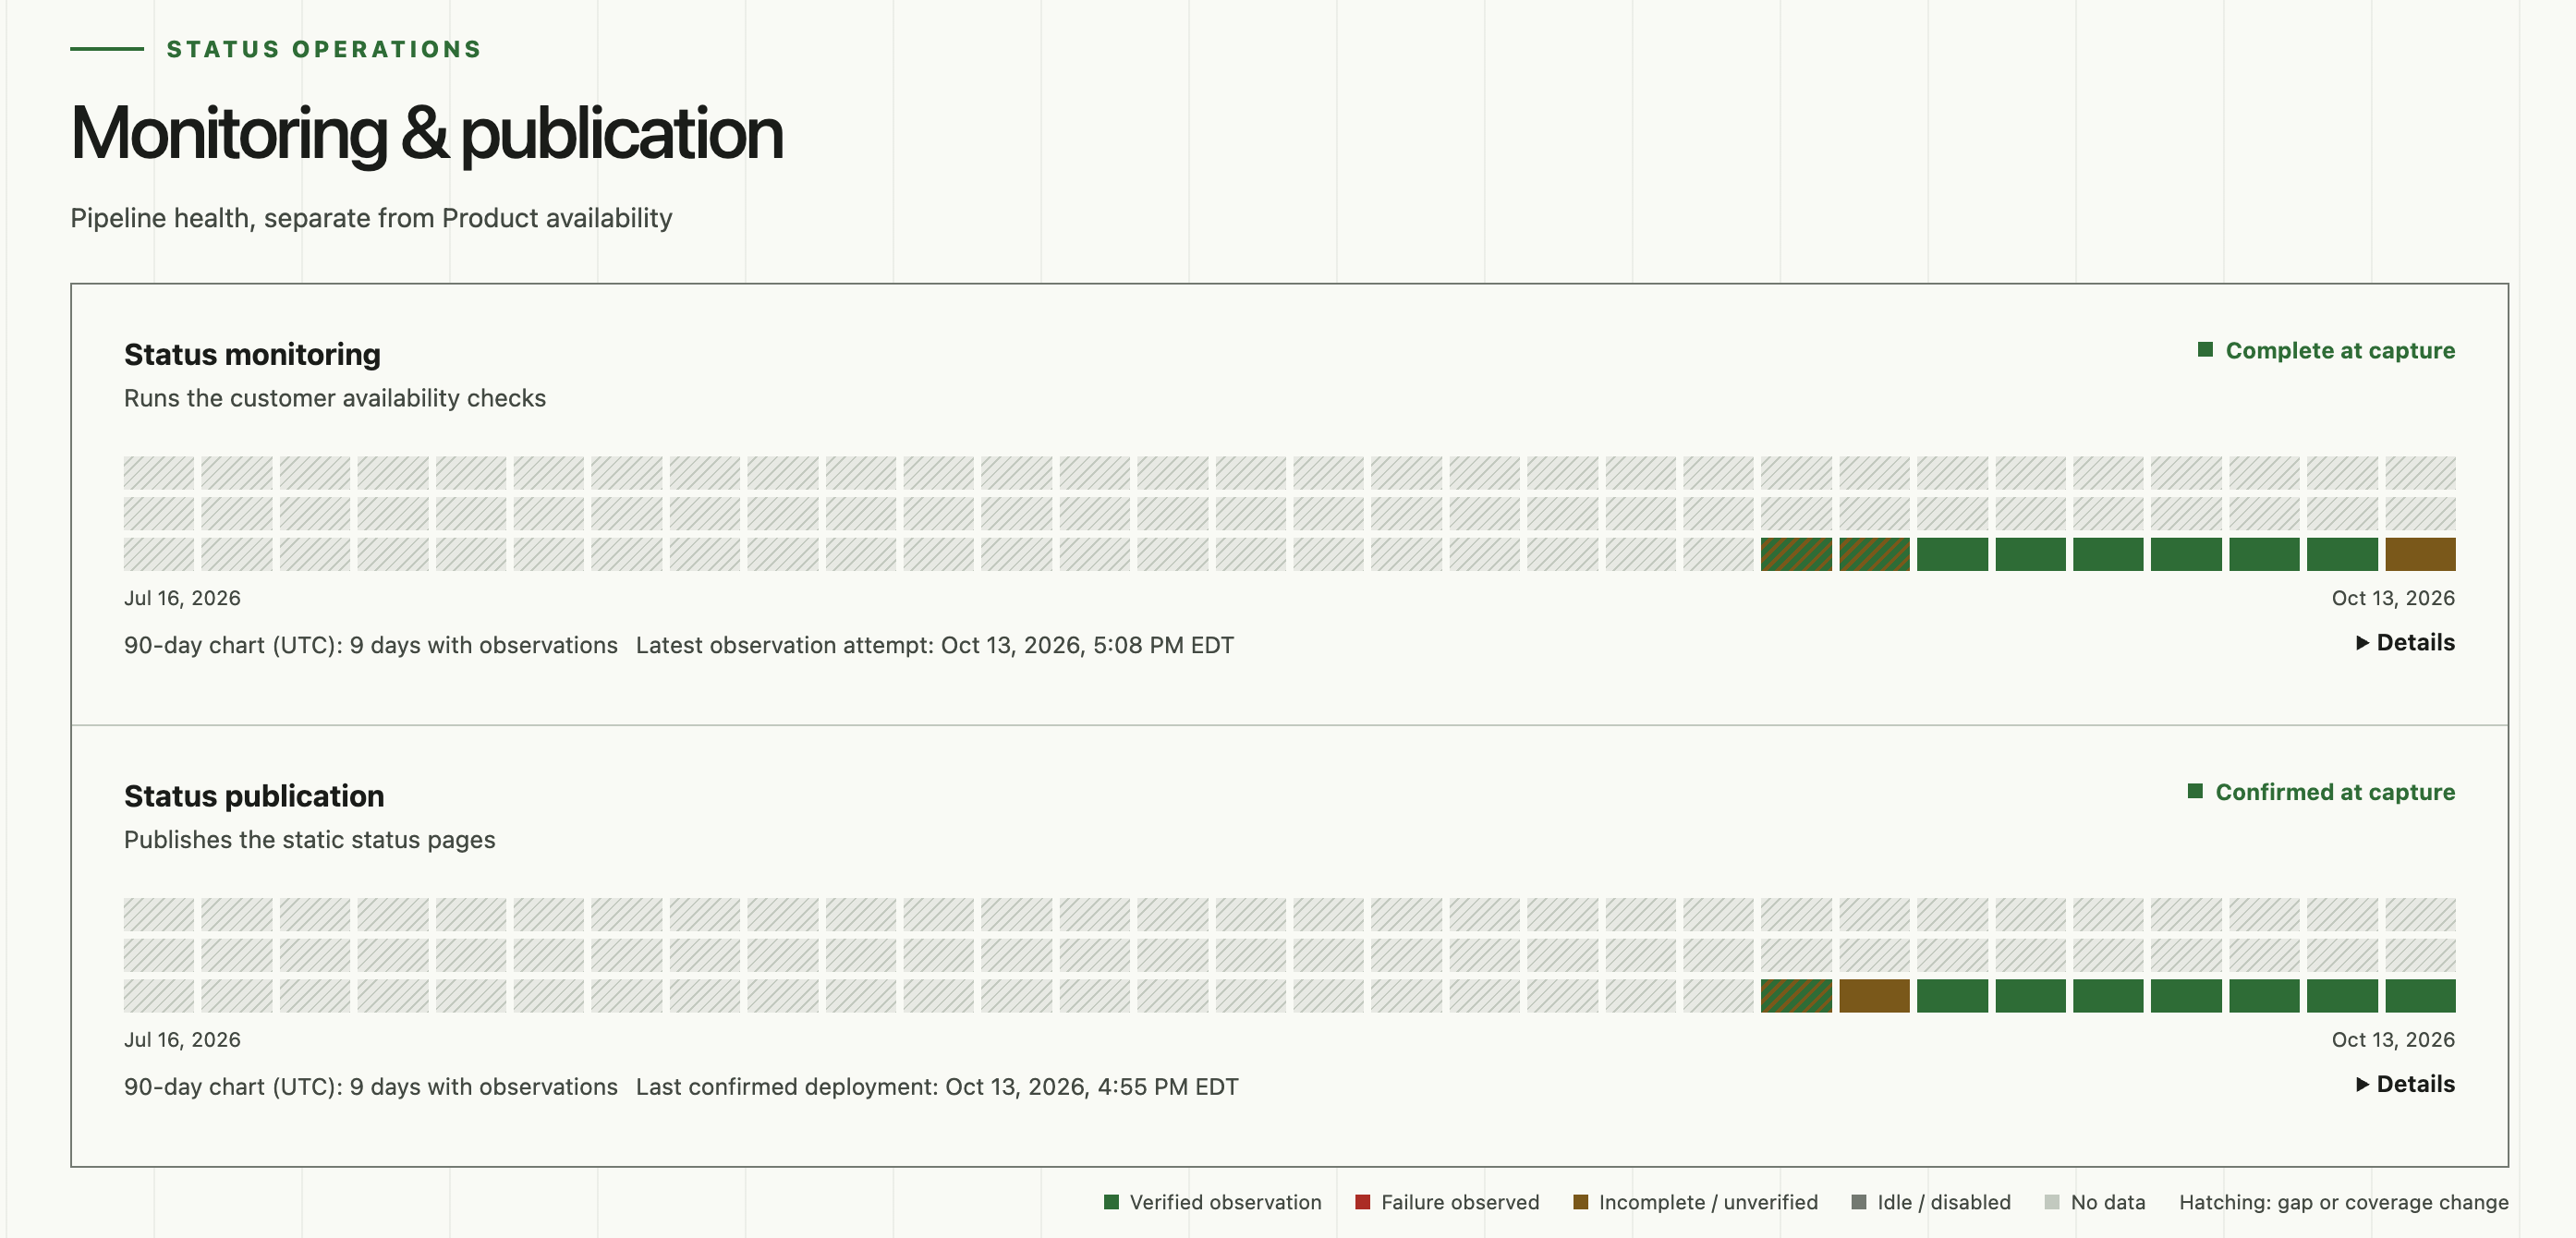
Adding the things customers wouldn’t necessarily see
Public checks can tell us whether a page loads, but they don’t cover everything happening behind it. We added an internal page for Demo, Staging and selected backend features so we could see more than public availability.
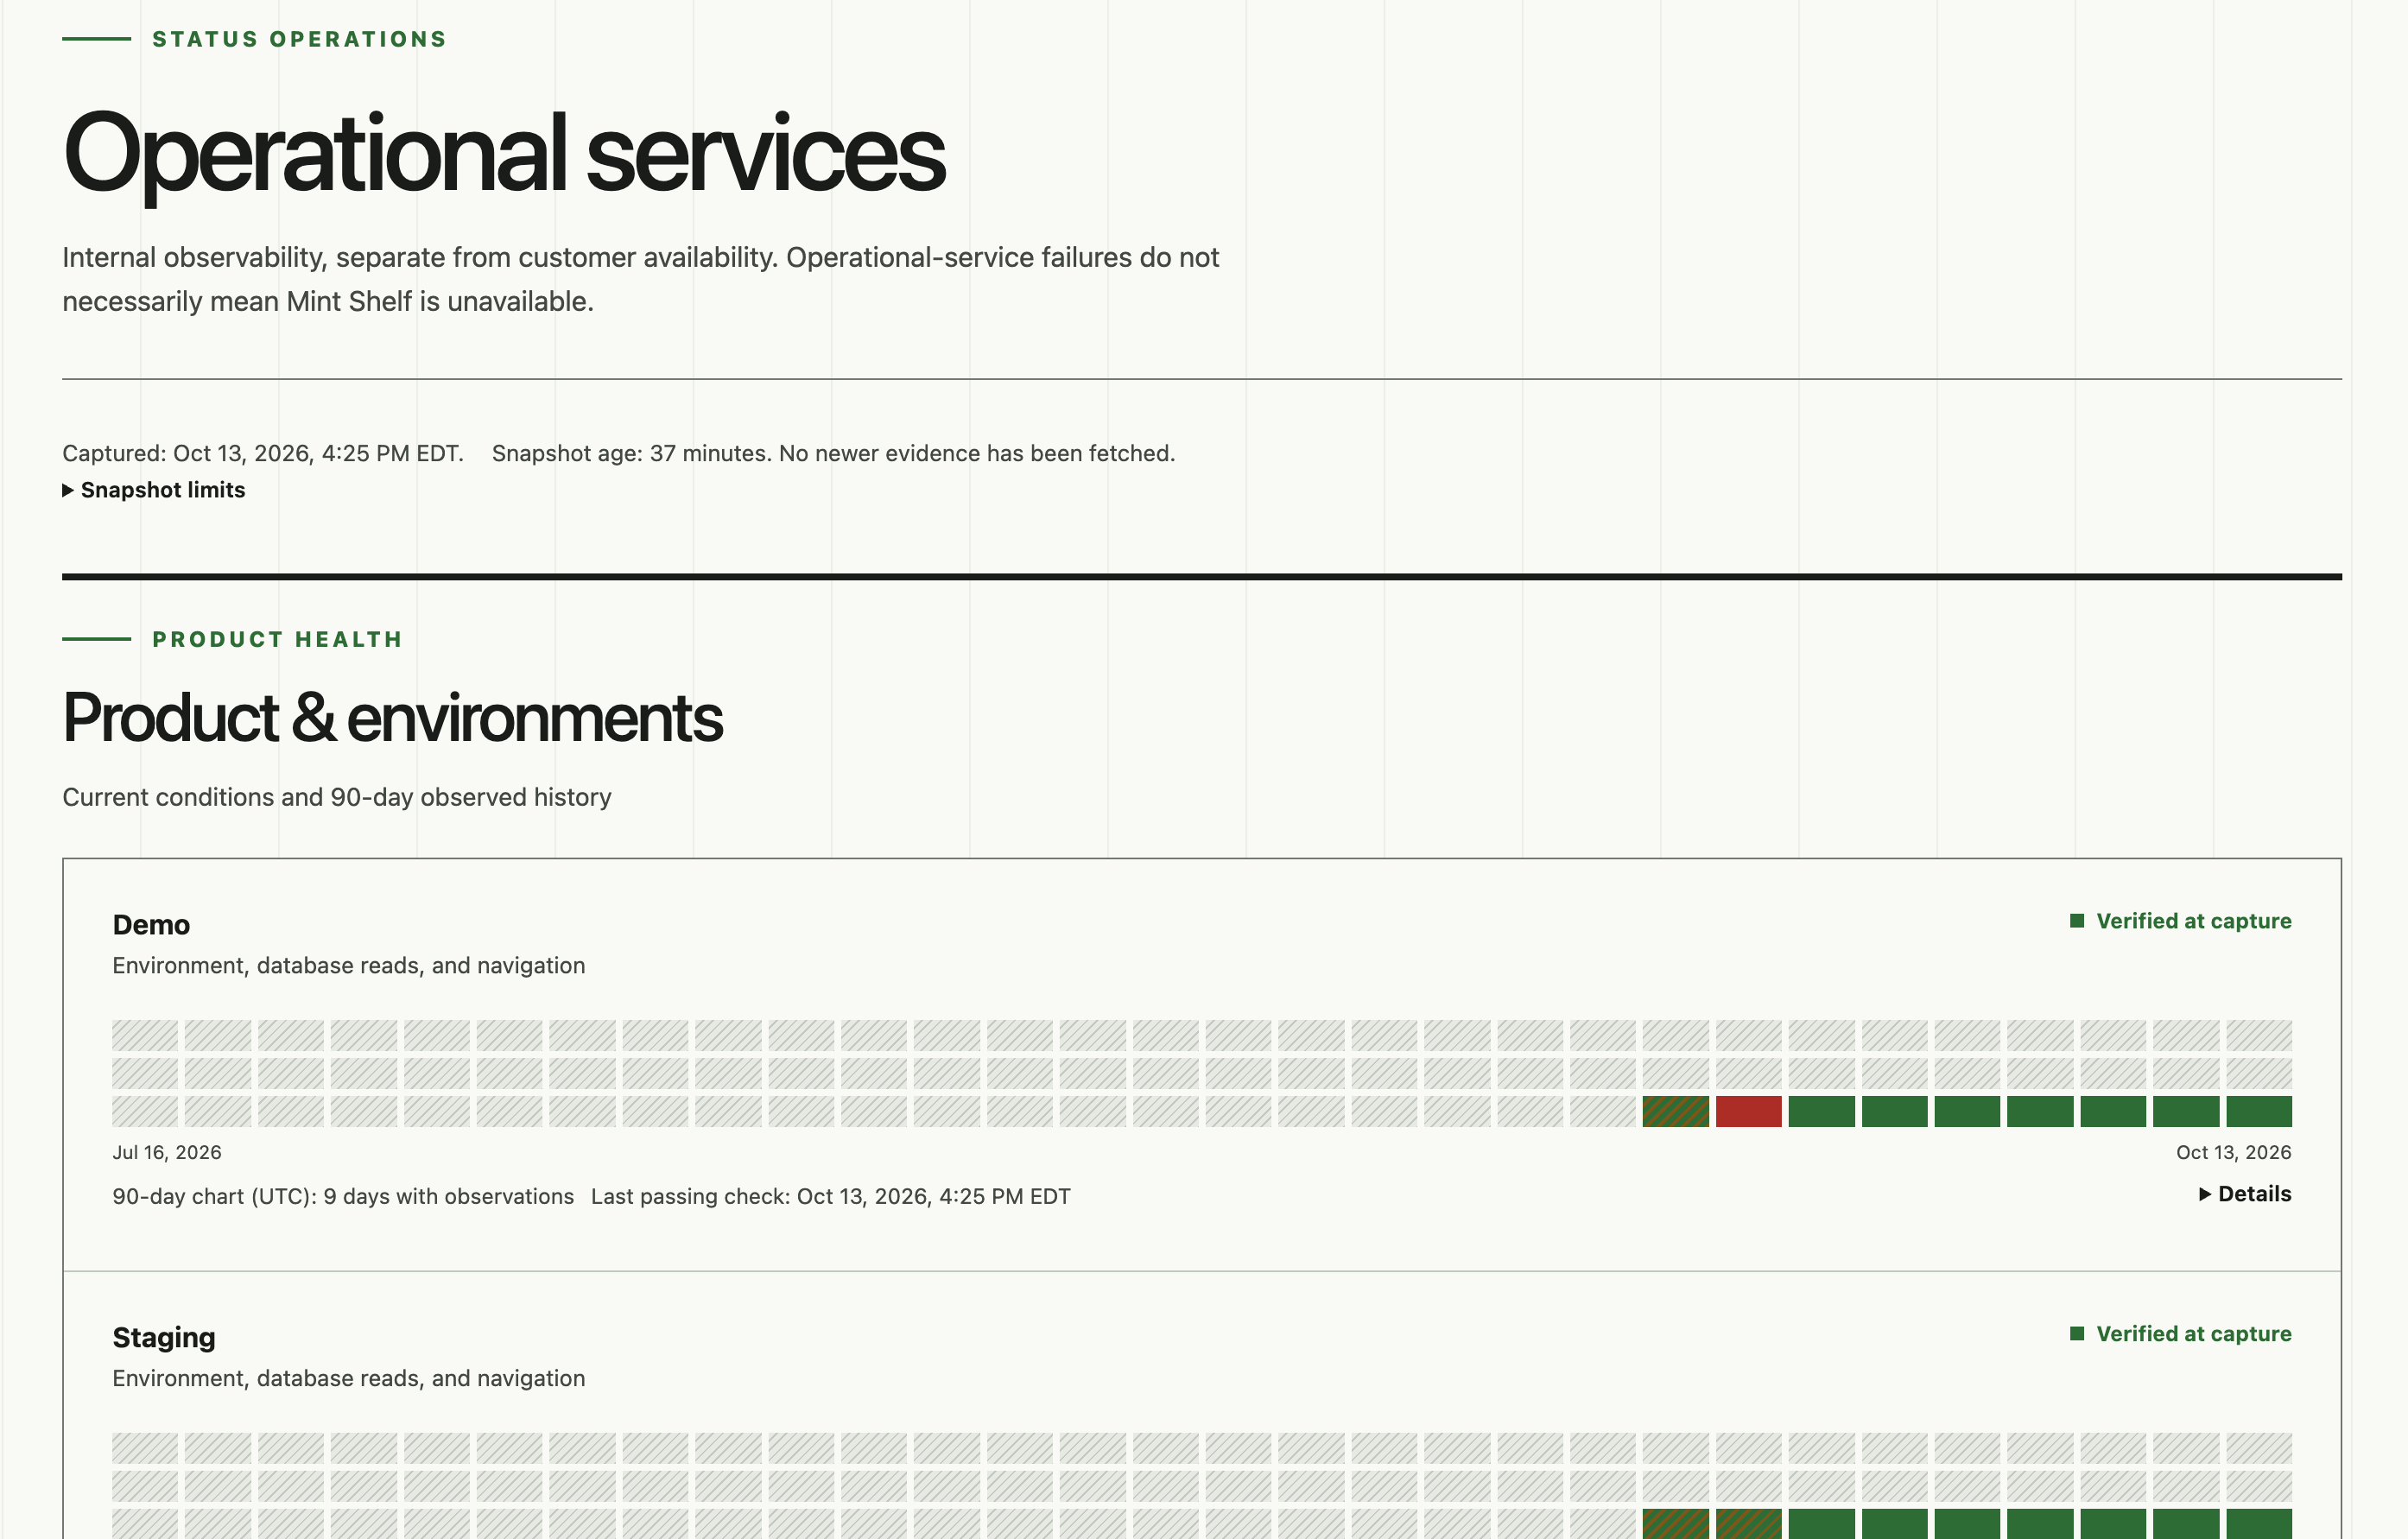
For Demo and Staging, the checks verify environment identity and database health, then use the browser to follow a journey from the homepage to Explore. The internal page also shows evidence from selected background jobs, messaging, payment webhooks and analytics.
We didn’t want routine monitoring to make purchases or send messages to customers. Instead, the application exposes a protected summary of existing processing evidence, which Status reads without running those business operations itself.
Some results therefore need qualification. If no messages have been sent recently, the absence of recorded errors doesn’t prove that messages are reaching people. A payment webhook being acknowledged doesn’t necessarily mean its business processing succeeded, either. The internal page can show those categories as unverified without treating them as failed.
Analytics gave us something we could actively test without involving customers. The monitor sends identifiable test events through the application’s browser and server analytics paths, then subsequent scheduled runs query PostHog for those exact events. That checks whether they arrived instead of assuming the sending code worked.
Getting that check into normal operation took more work than we expected. A diagnostic page could be clicked before its handler was ready, release information didn’t always match, and the verification query had a timestamp-format problem. We investigated each issue and made focused corrections, keeping the event-matching rules intact. Finding some event in PostHog wasn’t enough; it needed to come from the intended attempt and release. After correcting the timestamps, two distinct attempts verified both analytics paths and established recovery.
Checking the work after it shipped
To verify the monitoring, we needed to test more than successful responses. We used automated tests to exercise failed pages, missing events, delayed recovery and unavailable checking tools in isolation. That let us check how the system reported those conditions without causing failures for customers.
For substantial changes, we also used a focused PR, an independent audit, a further review of the code and audit findings, and approval before merge. After deployment, we inspected normal monitoring runs, saved evidence and the hosted page to confirm that the system worked through its usual schedule and published results that agreed with what it had recorded.
There were still mistakes to correct after tests had passed. In one recent case, monitoring was incomplete but the page deployed successfully. The workflow nevertheless sent a publication-failure signal, and the tests expected it to do that. They were passing against the wrong expectation.
We changed the workflow and its tests so monitoring and publication report their own outcomes, and added small browser diagnostics without logging page contents, credentials or raw provider errors. After review and testing, the deployed change completed a normal live observation and publication.
Our status system now has more reliable scheduling, checks that handle legitimate empty results, and an internal view of services the public page doesn’t cover. A managed product could take some maintenance off our hands, and that may be the right choice for another team. For us, using our existing tools and being able to explain and adjust the checks has been worth the work. Building our own gives us the control to do that without fitting every check into someone else’s status-page product.
Go give our status page a look.